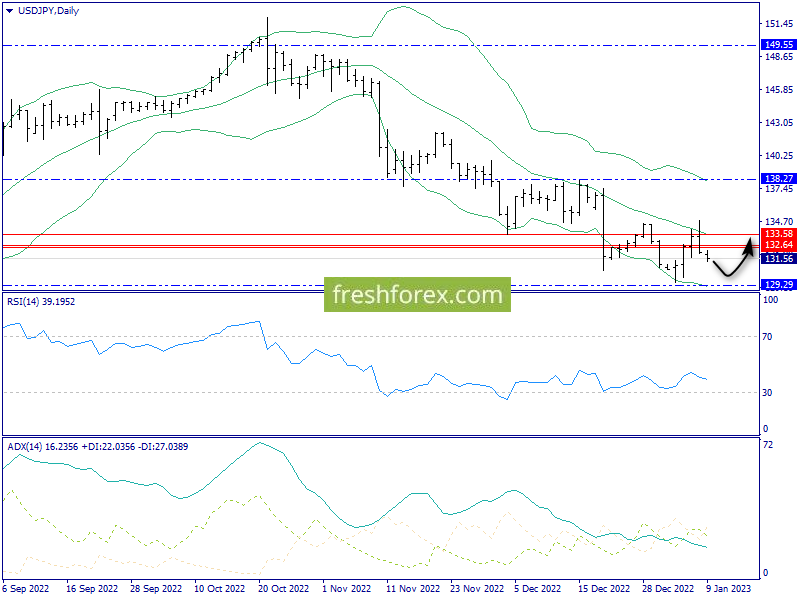
daily graph : the bulls could not gain a foothold above the middle band of the Bollinger, after which the couple again moved to a decrease. Buyers may be again interesting to zone 131.00, where a U -turning bull pattern is visible. However, the lower strip of the Bolinger is dramatically lower – at the level of 129.29, which is below even the last minimum.
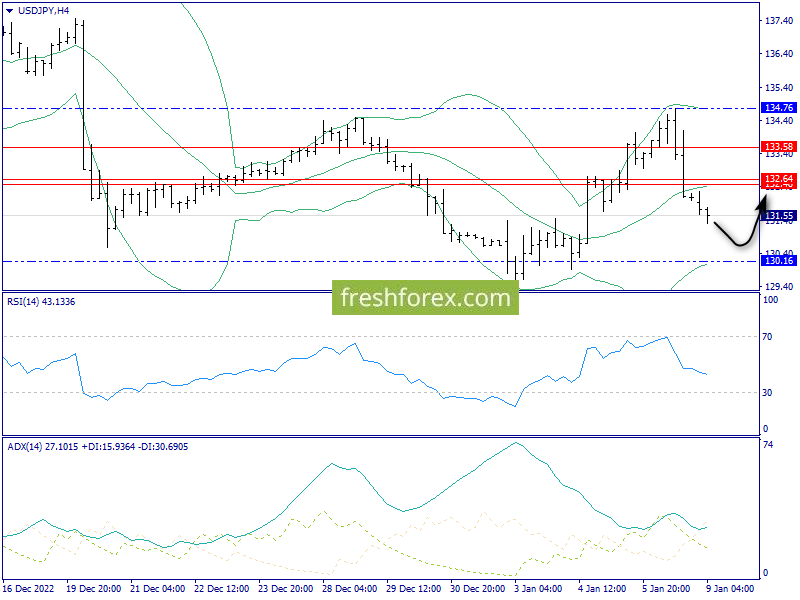
N4 : Here the lower line of the Bolinger is located at 130.16. Thus, it is here that the critical boundary of the “decision -making” for bear Or bull scenarios.
N1 : the intraday dynamic level of support is also at the level of 130.16 today, which increases its significance both as targets for sellers and as entry zones for customers.
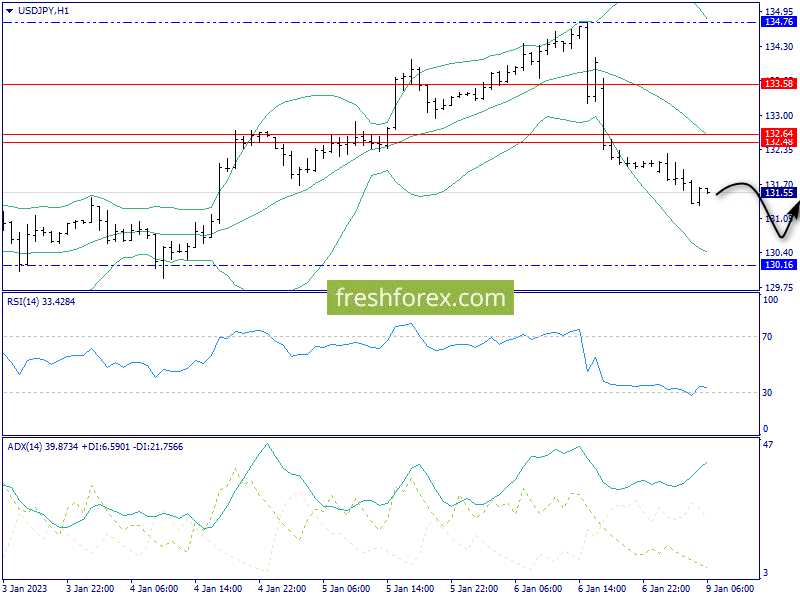
Conclusions : decrease by 130.16, then U -turn up.
Trade decisions :
1. Sales by 130.16.
2. Purchases from 130.16.